Blarch — blockchain events dashboard
A commercial MVP dashboard for retrieving, filtering and exporting blockchain smart contract events across multiple networks.
Overview
Blarch helps blockchain analysts and developers find smart contract events across several networks in one place, filter them and export the data. The MVP had to validate the core workflow and lay a scalable foundation for future analytics features.
Challenge: analysts and developers check events across networks, contracts and block ranges, and the tools they had were fragmented, overly technical and limited when it came to exporting data.
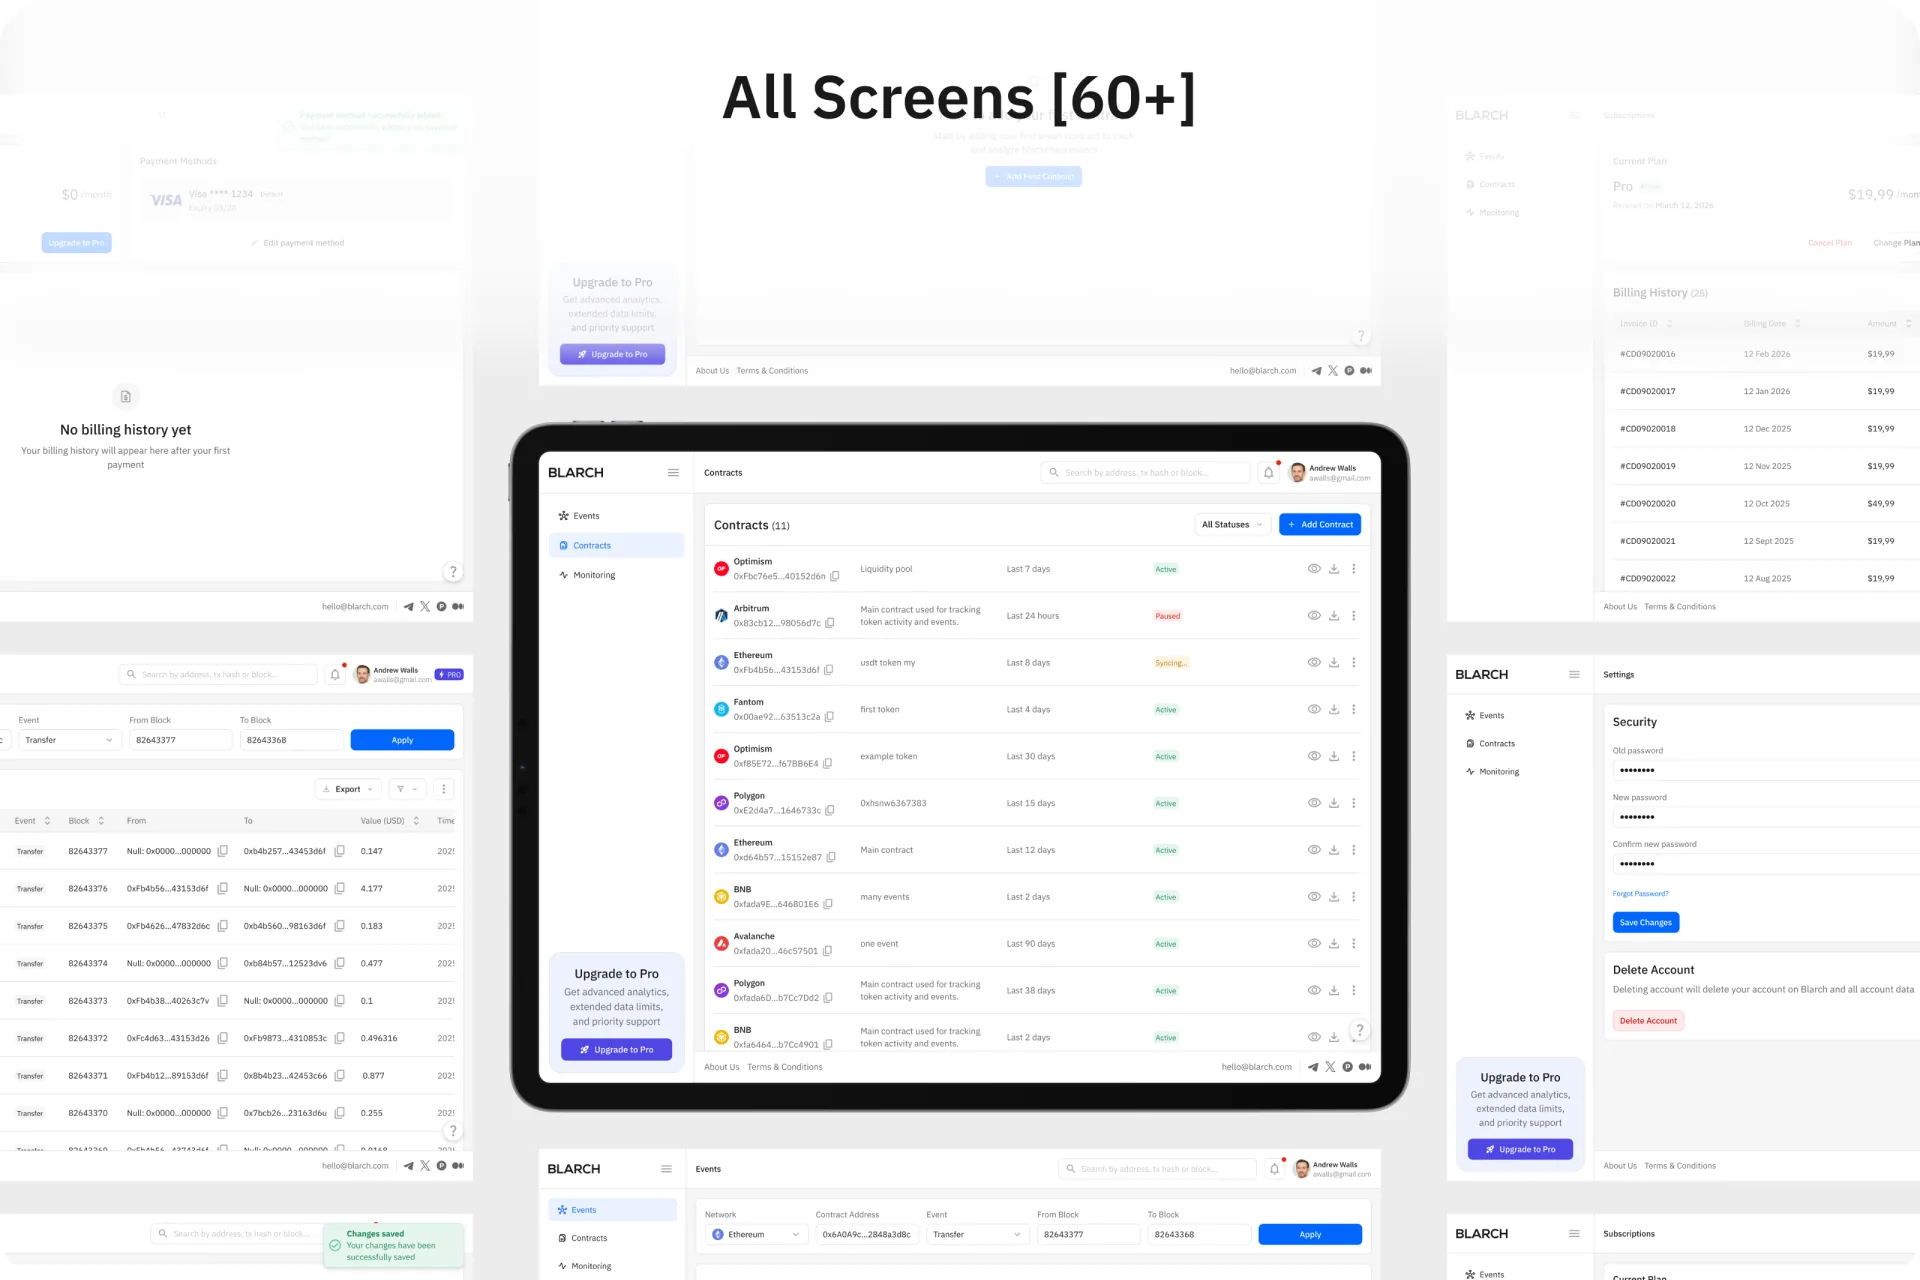
My role: I designed the MVP as the UX/UI designer: the user flow, 60+ screens for events, contracts, monitoring, plans and settings, and the visual system behind them.
Result: 60+ screens that cover the whole workflow, from sign-up to export, built on one consistent visual system for dense data.
What was the problem?
Blockchain analysts and developers often need to check events across multiple networks, contracts and block ranges. The tools they used made this harder than it should be:
What did I expect to change?
Why this solution?
Three decisions shaped the dashboard:
Why IBM Plex Sans
Its neutral, technical look fits a blockchain analytics tool, and its open letterforms keep dense tables, filters and form fields readable.
How did I solve it?
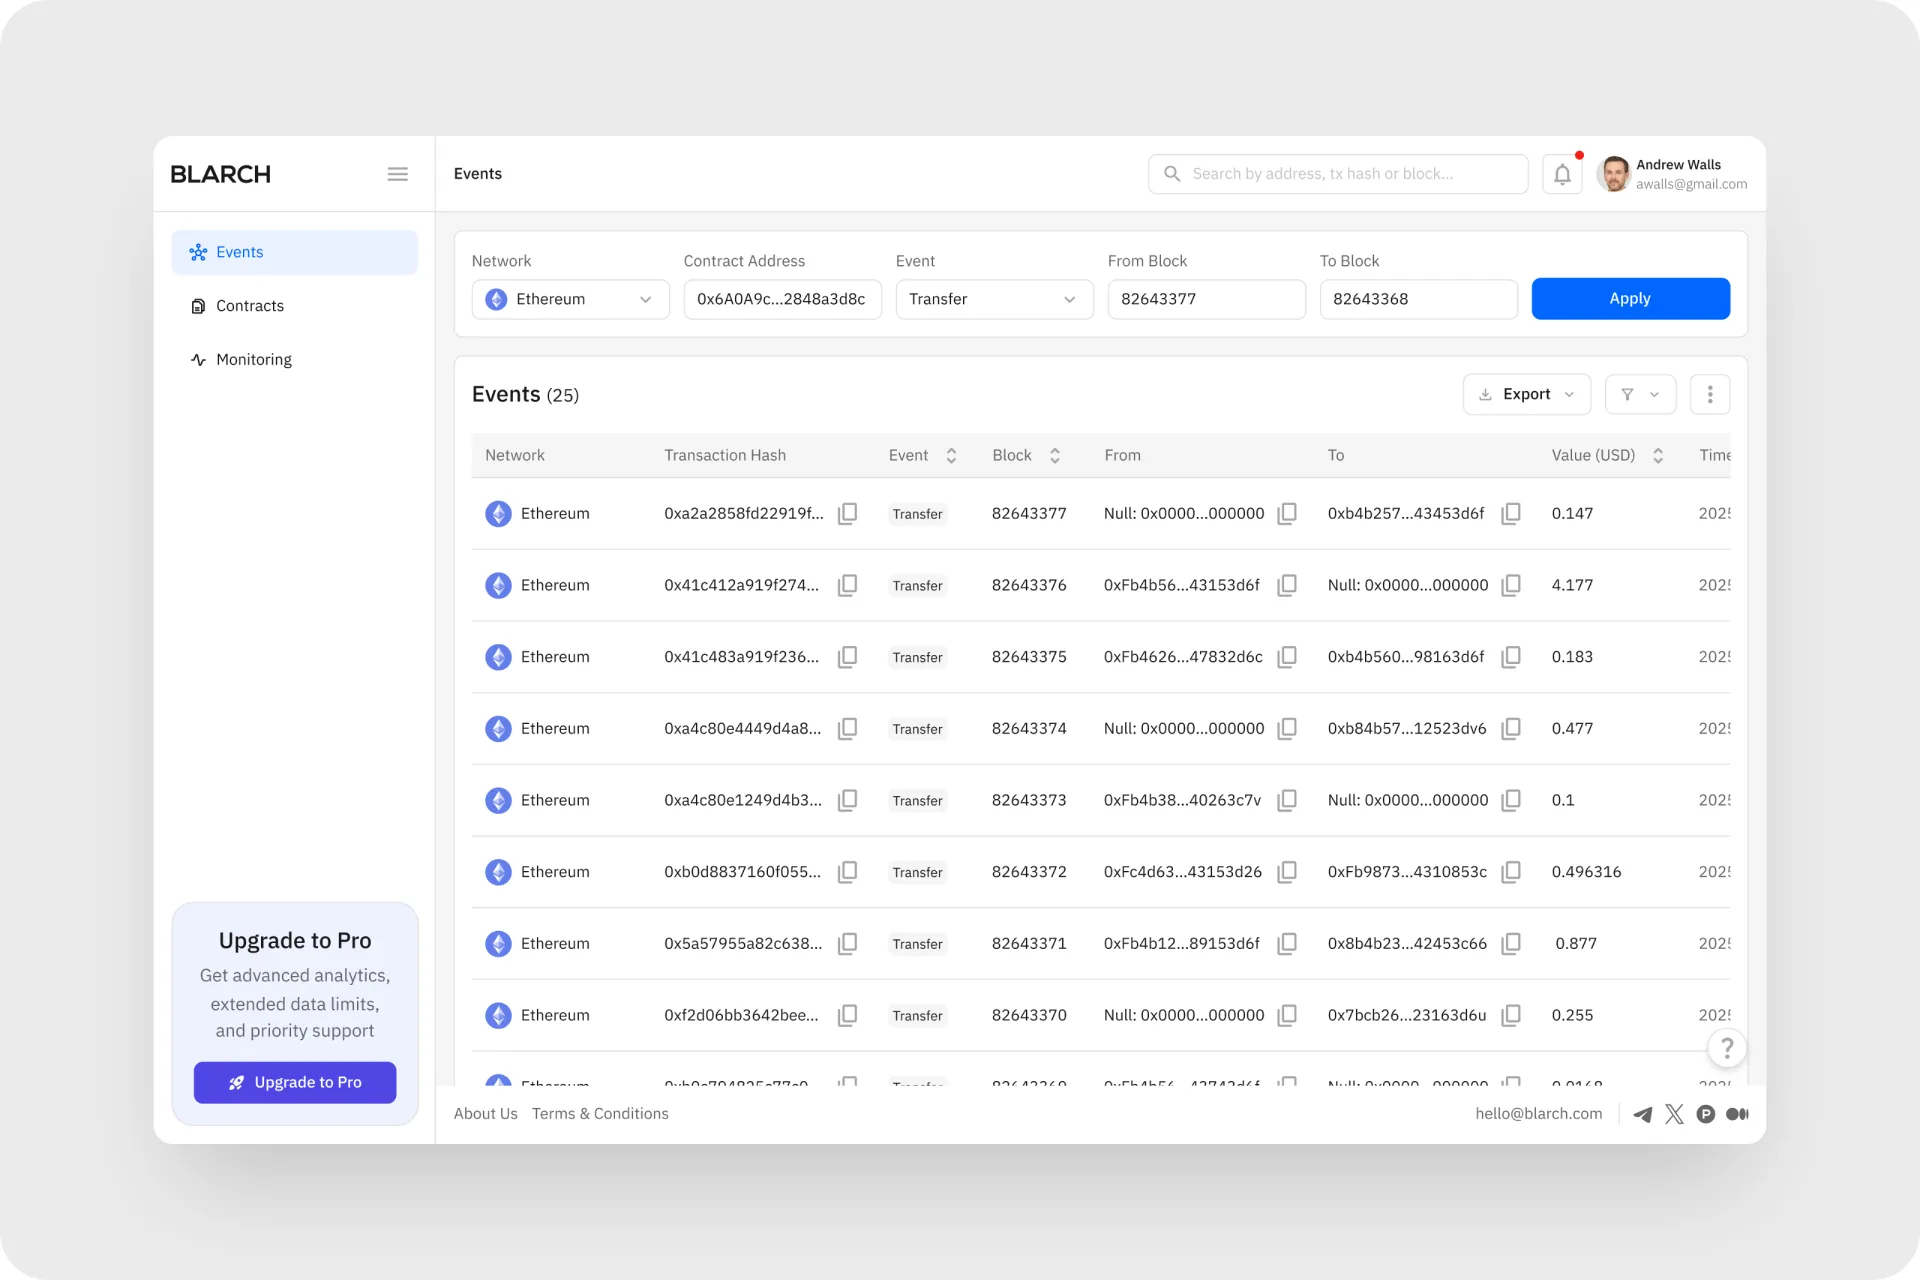
Events: filter, check, export
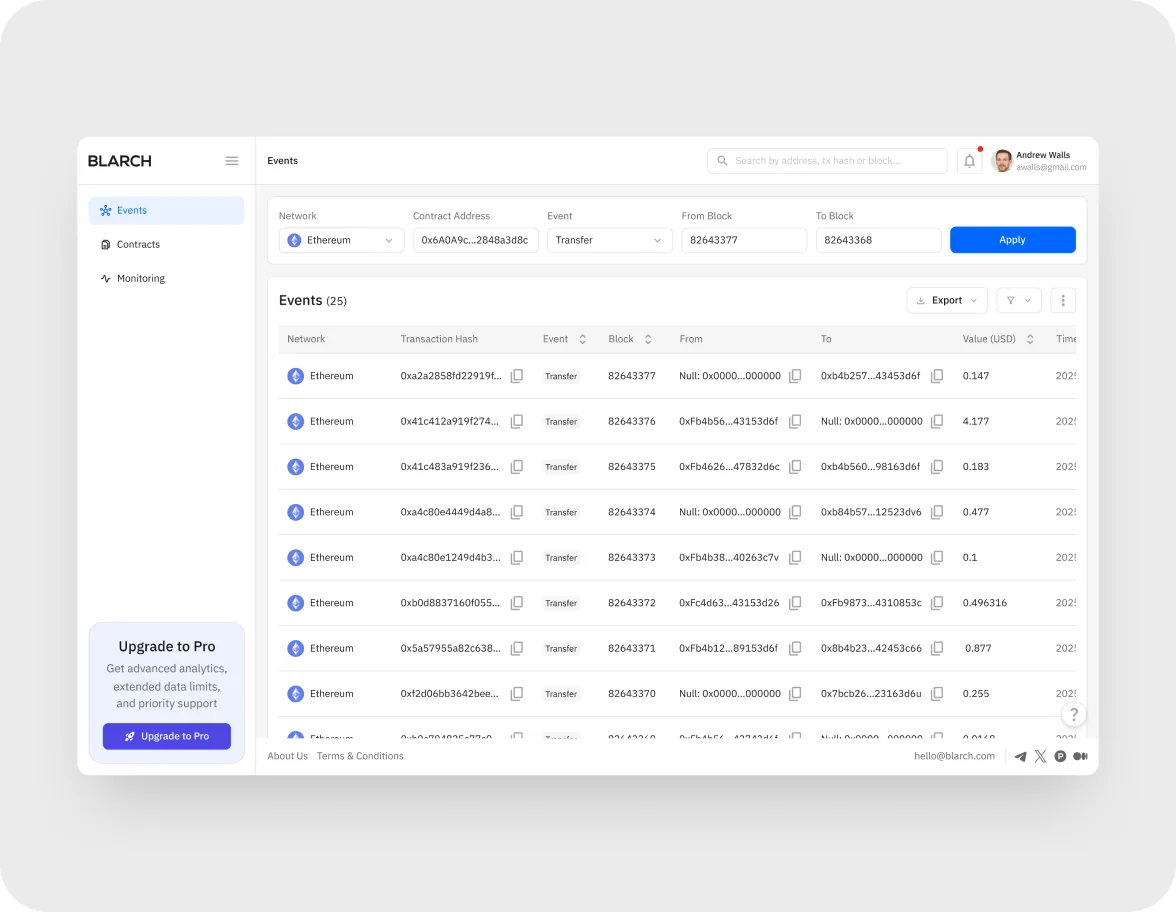
- One filter row covers network, contract address, event and block range, so a lookup takes a single pass
- The events table shows transaction hash, block, sender, recipient, value and time, with copy buttons for long hashes
- Filtered results export straight from the table for auditing, reporting or further analysis
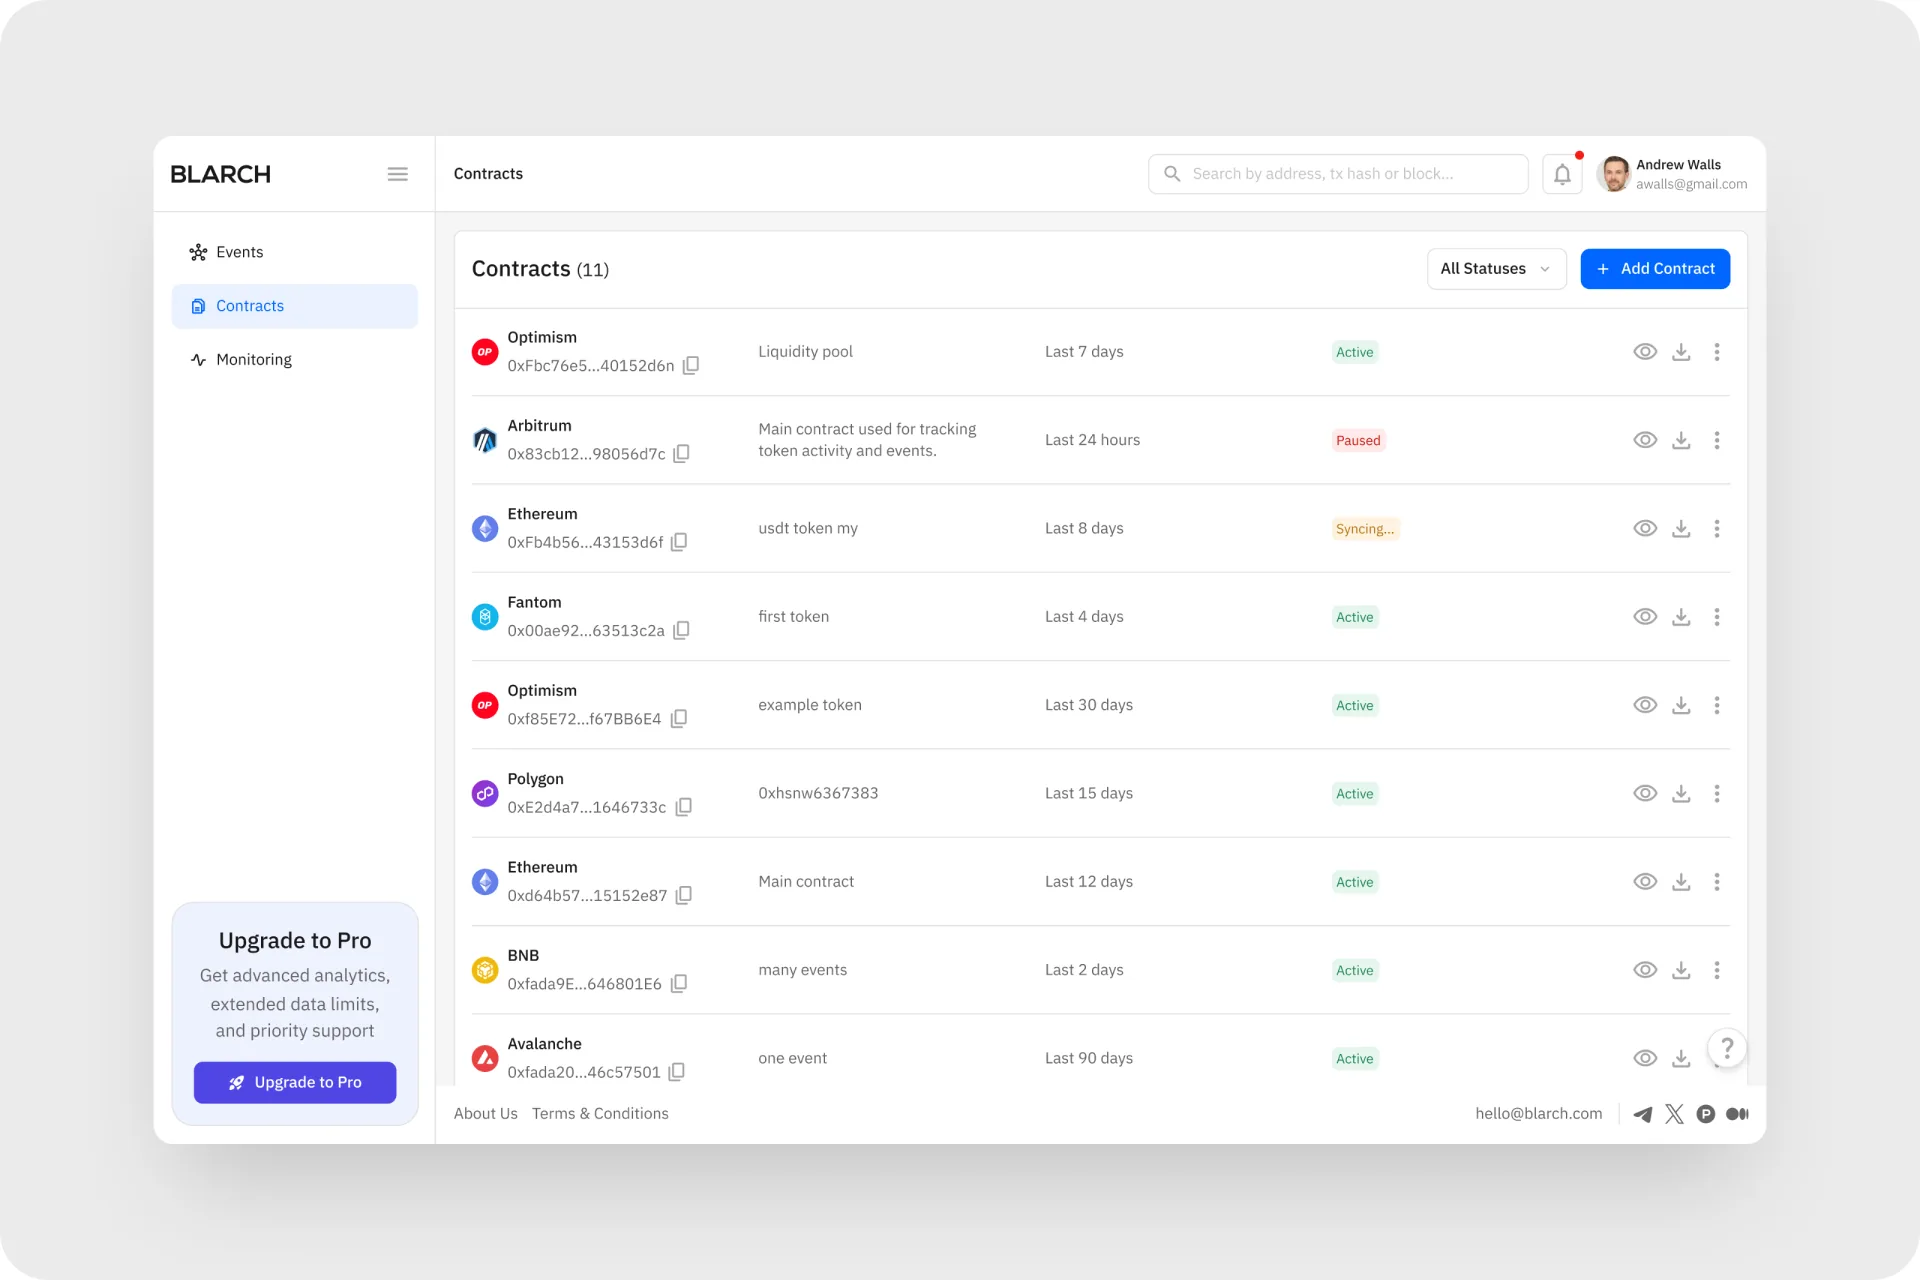
Contracts, plans and account
- Contracts is the hub for every tracked contract: users add, edit or remove contracts and see status and last activity
- Upgrade to Pro compares Free, Pro and Enterprise plans, and Subscriptions keeps billing history, invoices and payment methods in one place
- Settings groups profile and security, with password requirements shown next to the form
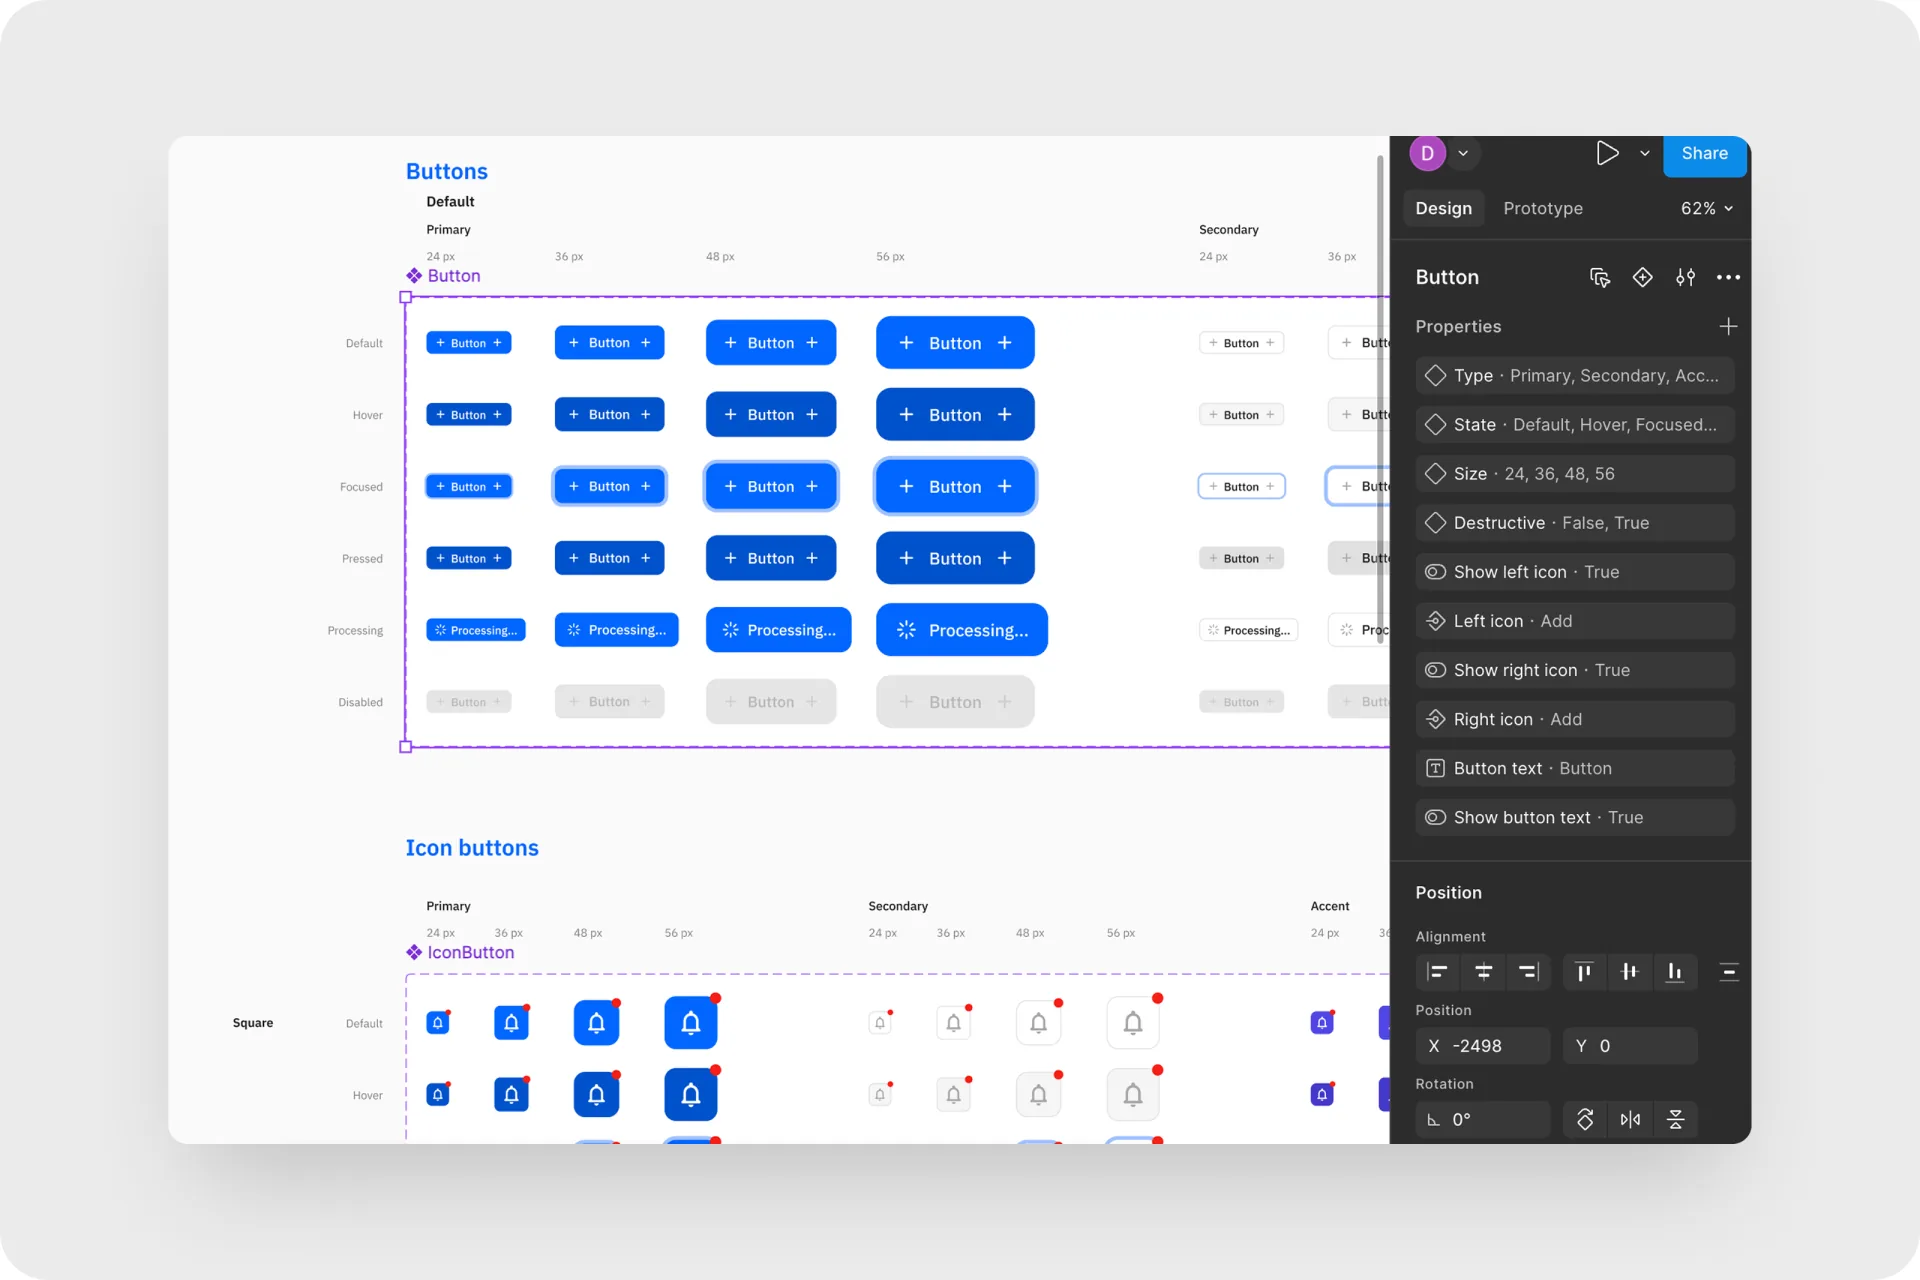
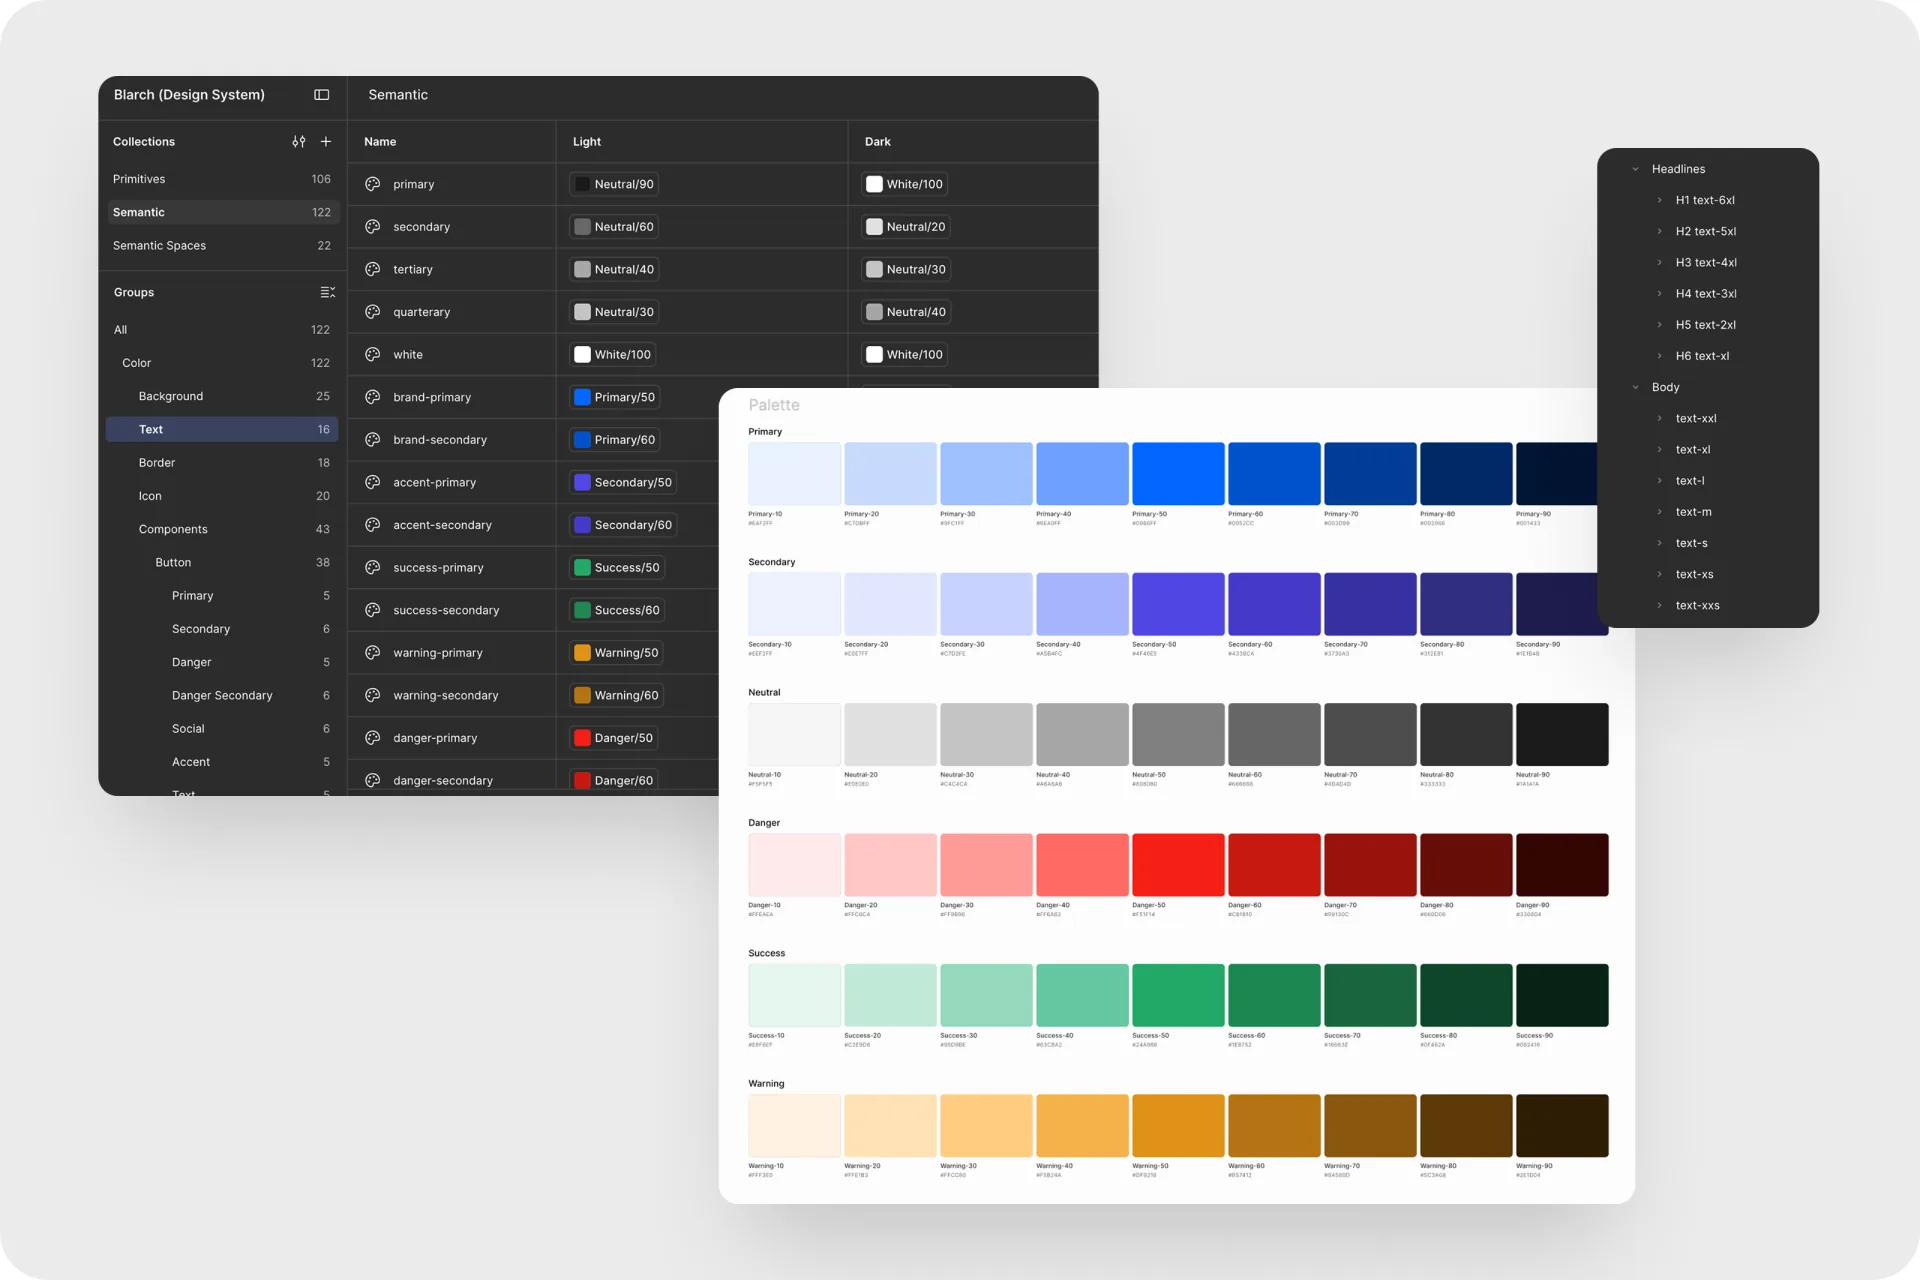
Design system
- IBM Plex Sans with a full set of heading and body text styles, H1 to H6 and XXL to XXS
- Color primitives in six scales, primary, secondary, neutral, danger, success and warning, mapped to semantic tokens with light and dark modes
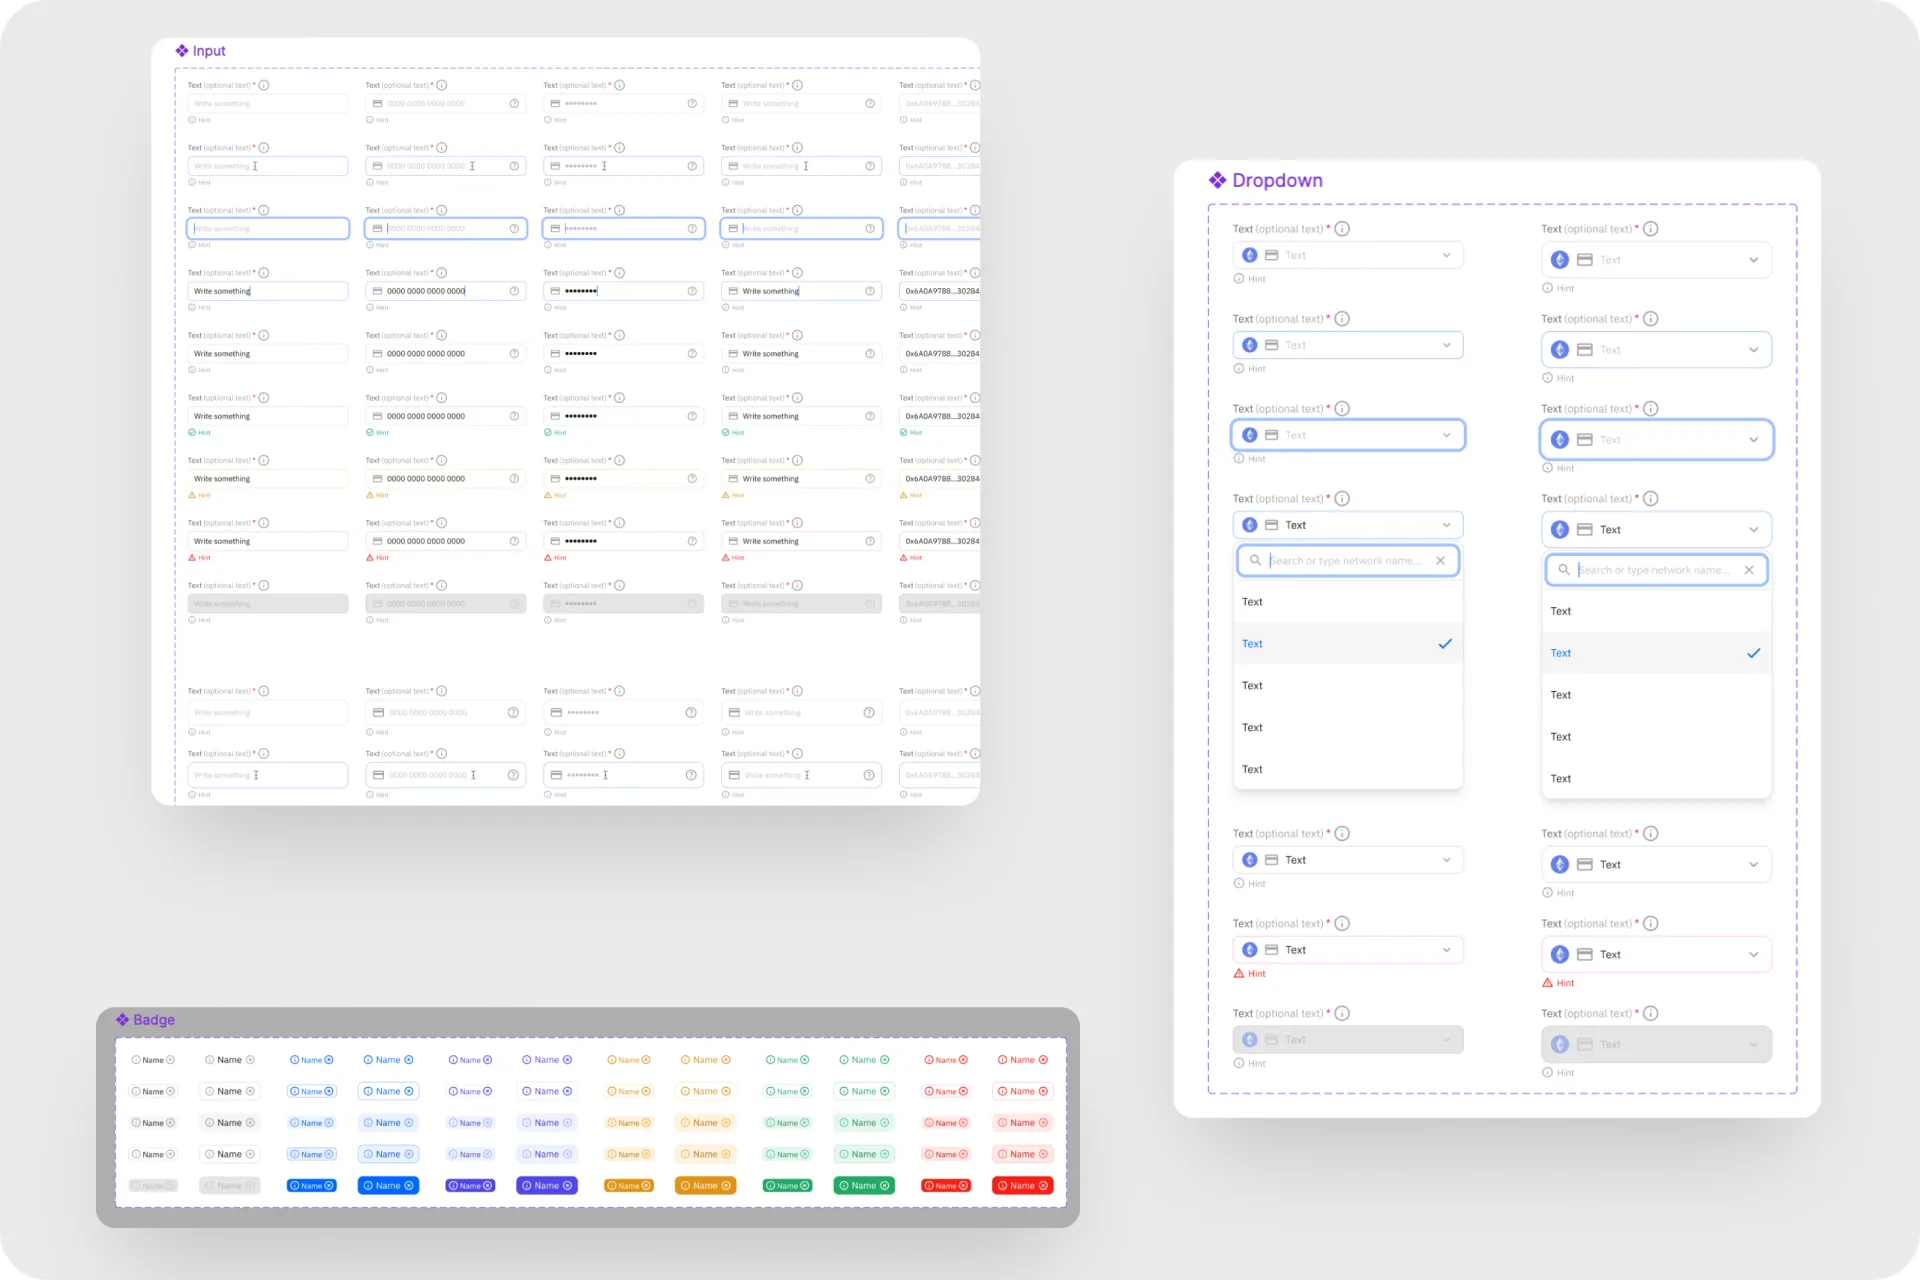
- Components with full variant sets: buttons, icon buttons, inputs, badges and dropdowns, so every one of the 60+ screens is built from the same parts
Where it stands
The MVP design covers the core workflow and leaves room for the analytics features planned next.
Key takeaways
- Dense data needs a calm interface. Neutral type, a small palette and white space keep a table full of hashes readable.
- Design the business side early. Plans, upgrade prompts and billing were part of the MVP from the start.
- Next. Build analytics on top of the collected event data.